 By Nick Quirk
August 1, 2026
9 min read
By Nick Quirk
August 1, 2026
9 min read
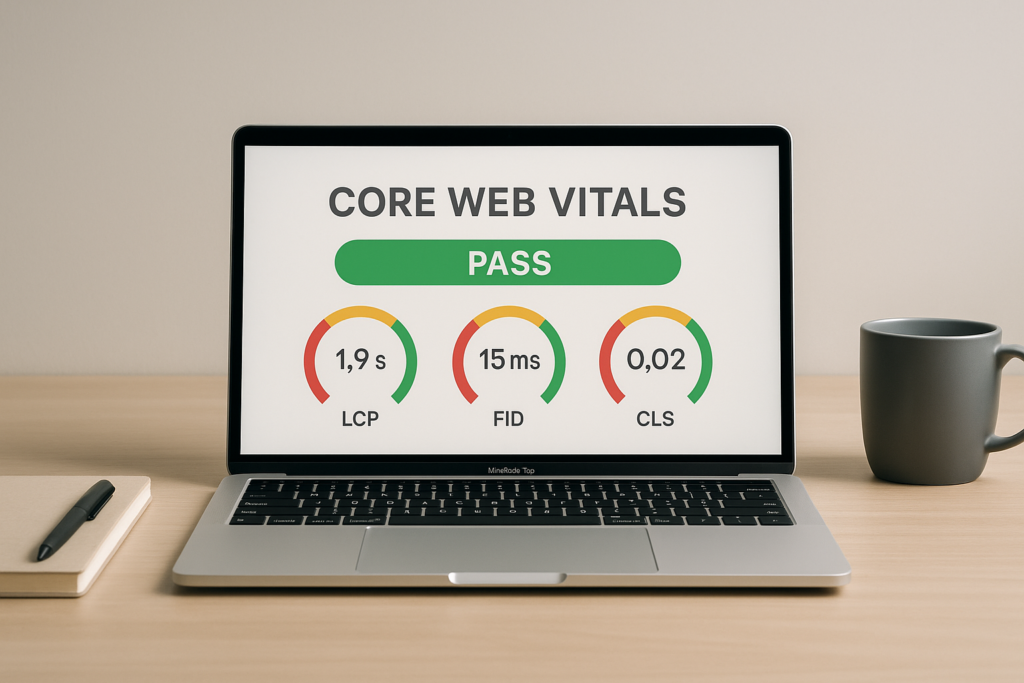
Core Web Vitals are the three field metrics Google uses to score how a real page feels to a real visitor: loading speed (LCP), responsiveness (INP) and visual stability (CLS). To pass the Core Web Vitals assessment, a URL needs to hit the “good” threshold on all three at the 75th percentile of real user visits over a rolling 28 days. That last sentence is where most site owners get stuck, because they optimize for a lab score and then wonder why Search Console still shows red.
This guide walks through what each metric measures, what a passing Core Web Vitals score actually looks like, why the assessment lags behind your fixes, and how to prioritize work so you are not burning weeks on pages nobody visits.
What Google’s Core Web Vitals Assessment Measures
The assessment is a pass/fail verdict, not a number out of 100. Google looks at anonymized field data from Chrome users who actually loaded your page, then checks whether the 75th percentile value for each metric falls inside the “good” band.
- Largest Contentful Paint (LCP): how long until the biggest visible element (usually a hero image, video poster or headline block) finishes rendering. Good is 2.5 seconds or less.
- Interaction to Next Paint (INP): how quickly the page visually responds to taps, clicks and key presses across the whole session, not just the first one. Good is 200 milliseconds or less.
- Cumulative Layout Shift (CLS): how much content jumps around while the page settles. Good is 0.1 or less.
INP replaced First Input Delay in March 2024 and it is a much harsher metric, because it measures the full interaction (input delay, processing time and the paint that follows) rather than just the queue wait. Plenty of sites that comfortably passed FID now fail Core Web Vitals on INP alone. Google’s own documentation on Web Vitals keeps the current thresholds and definitions up to date.
Why the 75th Percentile Matters More Than Your Average
Google does not use your average load time. It sorts every recorded visit and takes the value at the 75th percentile, meaning three out of four visits must be good for the URL to pass. If your desktop fiber users load in 1.2 seconds but a quarter of your traffic is on mid-range Android phones over LTE at 4 seconds, you fail.
The data source is the Chrome User Experience Report, a public dataset of real Chrome visits. It updates on a 28-day rolling window, so a fix deployed today will not fully show up in your Core Web Vitals score for about four weeks. That lag is the single most common reason people think a fix “did not work.”
How Much Do Core Web Vitals Actually Affect Rankings?
Honestly: less than the average blog post implies, but more than skeptics claim. Core Web Vitals are part of Google’s page experience signals, and Google has repeatedly described them as a differentiator between pages of comparable relevance rather than a way to outrank genuinely better content.
Where they matter most is in crowded commercial SERPs where five results all cover the same subject with similar authority. There is also a documented business case: Google has cited case studies where sites meeting all three thresholds saw noticeably lower bounce rates, and slow checkout flows are a well-known revenue leak regardless of search. Treat the assessment as one input alongside your broader technical SEO foundation, not as a ranking silver bullet.
We cover this topic in more depth in XML Sitemaps: How to Create and Submit Them to Google.
How to Run a Core Web Vitals Test (Free Tools That Use Field Data)
Any free Core Web Vitals test is worth running, but only some of them show the field data Google actually grades you on. The distinction between lab and field is what separates a useful audit from a wasted afternoon.
- Google Search Console, Core Web Vitals report: the closest thing to the official verdict. It groups similar URLs together and tells you how many pages are poor, need improvement or good, split by mobile and desktop.
- PageSpeed Insights: shows CrUX field data at the top (if the URL has enough traffic) and a Lighthouse lab run underneath. Read the top section first; the bottom section is diagnostics only.
- The Web Vitals Chrome extension: overlays live LCP, INP and CLS values as you browse your own site. Useful for catching a layout shift you can see but cannot name.
- Lighthouse in Chrome DevTools: great for finding the cause, useless as a scoreboard. A Lighthouse score of 100 does not guarantee you pass the Core Web Vitals assessment, and a score of 68 does not mean you fail.
- The CrUX dashboard on BigQuery or Looker Studio: free, origin-level, and shows month-over-month trends so you can prove a fix landed.
What “Not Applicable” or Missing Data Means
If PageSpeed Insights says there is not enough real-world speed data, the URL simply does not get enough Chrome visits to make a statistically meaningful sample. Small business sites and new blogs hit this constantly. In that case Google falls back to origin-level data or to the URL group in Search Console, so improving your site-wide templates still helps even when individual pages show nothing.
The Most Common Reasons Sites Fail
After auditing dozens of sites, the same handful of causes account for the large majority of failures. They are boring, which is exactly why they persist.
- Oversized hero images: a 1.8 MB JPEG served at 400 px wide will sink LCP on mobile every time. Modern formats and correct dimensions usually cut LCP by a second or more, which is why image optimization is the highest-return fix on most sites.
- Render-blocking CSS and fonts: web fonts loaded without
font-display: swapdelay text paint and can trigger layout shift when the real font swaps in. - Heavy third-party scripts: chat widgets, heat mapping, four analytics tags and a review carousel all compete for the main thread. Third-party JavaScript is the number one cause of poor INP.
- Ads and embeds without reserved space: any element injected after paint without a fixed width and height will push content down and spike CLS.
- Bloated page builders: some WordPress themes ship 600 KB of unused CSS on every page. Trimming that is tedious but it is often the difference between 260 ms and 180 ms INP.
- Slow server response: if Time to First Byte exceeds 800 ms, no front-end trick will rescue LCP.
How to Pass: A Prioritization Order That Works
Most guides hand you a list of 30 fixes. The gap those guides leave is prioritization, because a fix on a page with 40 monthly visits does nothing to your Core Web Vitals assessment while a fix on your template hits thousands of URLs at once.
- Fix templates, not pages. Search Console groups URLs by similarity for a reason. Repairing your blog post template or product template moves an entire group from red to green in one deploy.
- Weight by traffic. Export your failing URL groups, cross-reference against Search Console clicks, and start with the group that carries the most impressions. This is the same logic behind refreshing high-potential old posts before touching the long tail.
- Attack mobile first. Mobile and desktop are assessed separately, and mobile is nearly always the failing half.
- Handle LCP before INP. LCP fixes (image compression, preloading the hero, caching, a CDN) are cheaper and their gains are more predictable.
- Reserve space for everything. Explicit width and height attributes on images, embeds and ad slots is the fastest route to a CLS under 0.1.
- Break up long JavaScript tasks. Defer non-critical scripts, lazy-load chat and review widgets on interaction, and audit tag manager containers for tags nobody reads.
- Wait 28 days, then re-measure. Verify the fix in Search Console using the validation flow, and resist redeploying “improvements” mid-window because you will not know what caused what.
Google’s Search Central documentation on Core Web Vitals is worth reading alongside your own data, since thresholds and the metric set have changed twice since 2020 and will likely change again.
Where Core Web Vitals Fit in the Bigger Picture
Passing the assessment removes an obstacle; it does not create demand. A page that loads in 1.1 seconds and answers the wrong question still will not rank. Pair your speed work with solid on-page optimization and a sensible internal link structure so that the crawl budget and authority you have are actually pointed at pages worth loading fast.
For small and local businesses, the practical target is simple: get mobile LCP under 2.5 seconds on your homepage and main service templates, keep CLS near zero, and strip the third-party scripts you cannot justify. That covers roughly 80 percent of what the assessment penalizes, and it is achievable in a week of focused work on most sites.
Frequently Asked Questions
How to pass Core Web Vitals assessment?
You pass by hitting all three thresholds at the 75th percentile of real Chrome visits over 28 days: LCP at 2.5 seconds or less, INP at 200 milliseconds or less, and CLS at 0.1 or less. Fix your page templates rather than individual URLs, prioritize mobile, and expect roughly four weeks before the change appears in Search Console.
What does Google’s Core Web Vitals assessment measure?
It measures three aspects of real user experience: loading performance, interaction responsiveness and visual stability. The data comes from the Chrome User Experience Report, so it reflects actual visits on real devices and connections rather than a simulated lab test.
What is a good Core Web Vitals score?
A good score is LCP under 2.5 seconds, INP under 200 milliseconds and CLS under 0.1, with all three measured at the 75th percentile. Anything between 2.5 and 4 seconds LCP, 200 and 500 ms INP, or 0.1 and 0.25 CLS lands in “needs improvement,” which still counts as a failed assessment.
What are Google Core Web Vitals and what do they measure?
Core Web Vitals are the three standardized metrics (LCP, INP and CLS) that Google uses as part of its page experience signals. They quantify how fast the main content appears, how quickly the page responds to input, and how much the layout shifts while loading.
Does a Lighthouse score of 100 mean I pass?
No. Lighthouse produces a simulated lab score on a single throttled run, while the assessment uses 28 days of field data from real visitors. Lighthouse is best used to diagnose causes after your field data tells you which metric is failing.
Want a Second Set of Eyes on Your Site Speed?
If your Search Console report has been stuck in the red for months and you would rather spend that time running your business, SEO Quirk can audit your field data, identify the template-level fixes worth doing, and tell you which ones are not worth the invoice. There are real advantages to working with a local agency that will actually pick up the phone.